Sunday, May 19, 2013

Valuing Thompson Creek Molybdenum Production, High Cast Costs

The unknowns in this valuation are how much mol is produced, how much it can be sold for and how much it costs to dig up. The price forecast is my solution to how much it can be sold for. Production estimates and cash costs are taken from TC estimates in SEC filings, but these numbers can be incorrect. Given that TC produces ~30 mlbs of mol a year, a $1 plb squeeze of estimated and real cash costs can drop (or add to) revenues by +/- $30M dollars. Margins decline and the mol business can quickly break-even or negative as CC plb changes. Estimated CC's in 2012 were $7.75-9.00 in the 2011 annual report, while the realized CC was $10 plb for 22 Mlbs of mol.

Since I have no understanding of  TC's vulnerability to cash cost increases, I'll run the high end CC's estimated for 2013+2014 to compliment the low-end forecasts given in the last post, and then I'll run one more outside of the range at $9 plb as an exceptionally bad case.

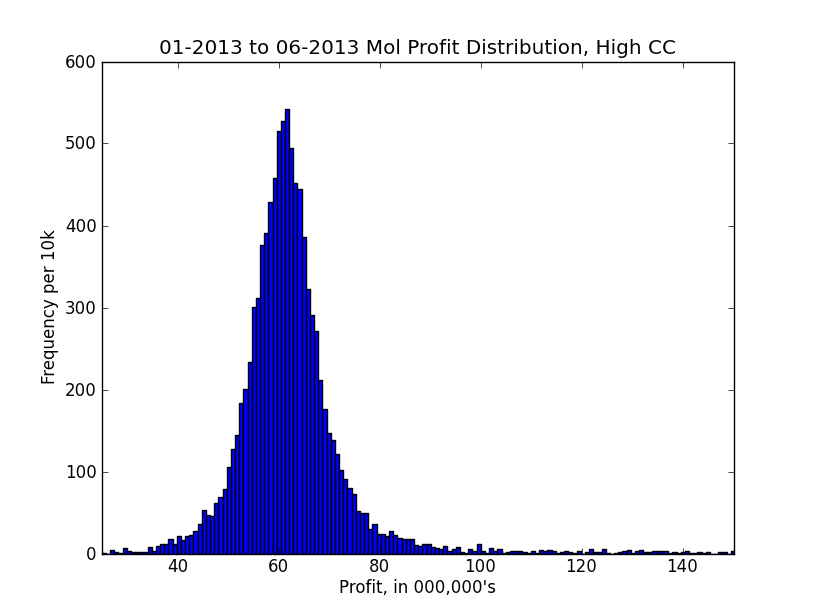
For CC's of $7.50 in 2013 and $7.75 in 2014 (estimates provided by TC):


For $9 plb:


This indicates that it should be a successful year for the mol business in TC. Unfortunately, TC's business is moving away from mol as plans exist to shut down the TC mine in 2015. Those efforts will go into Mt. Mulligan, a gold and copper producer. This will eliminate TC as a pure play producer and consequently, the best way gamble directly on mol prices. That said, TC's valuation has languished on the poor performance of the mol business. The pricing might not be right on that. Fortunately, I don't have money enough to care either way.

Monday, May 13, 2013

Valuing Thompson Creek Molybdenum Production

In the previous post, I presented results from a simple ARCH-based model aimed at creating a distribution of possible outcomes for mol prices using past tendencies. One way to use this information would be to directly value mol production based on corporate estimates for production and cash costs, which are often obtainable from SEC filings.
Taking the numbers from a table on P. 24 of TC's Q1 2013 report, the high-end estimate of 30.5 mlbs of mol in 2013 and 2014 means an average monthly production of ~2.55 mlbs with low end cash costs of $6.50 plb and high end CC's of $7.50 and $7.75 plb in 2013 and 2014, respectively. Without much difficulty, these can be fed into the model to create month-to-month profit from mol production by taking the price forecast net cash costs and multiplying by monthly production.

Here are the distributions of outcomes for the first and second half of 2013 and 2014 along with cumulative profits using the low-side cost of $6.50 plb and the high-side estimate for production.


Saturday, May 11, 2013

ARCH Modeling of Molybdenum Prices from 2013

I've compiled a time series of returns in molybdenum prices from a presentation by Roca Mines and put together an ARCH-based model to predict mol prices a few years out. The time series is a set of monthly returns ranging from 1992 to 2012, totaling around 185 observations. I'd give some utility to predictions out about 10 years but 0-5 gives less foggy results. Here's the presentation from Roca, prepared by CPM Group.


It's a simple ARCH-based model that generates a return at t as a function of the past return at t-1. The parameters of the model were tweaked by first generating 185 returns and then both minimizing residual differences between realized and generated returns numerically (a sort of chi squared) and visual comparison between generated and realized returns.

The addition that I've made is a probability-based inflationary mechanism. Mol prices go through periods of significant volatility, but it's hard to create the significant spikes such as 03-07 and in 94 so I've added a 4% probability each year for mol prices (once in 25 years) to experience an extended period of steady growth. From there, the ARCH component drives price volatility.

Here's what some individual runs and a histogram of prices outcomes at 32, 64 and 96 months look like:


Price percentiles below with format [99th, 95th, 85th, 50th, 15th, 5th, 1st].
96 months -[98.6, 52.37, 32.94, 14.58, 6.9, 4.46, 1.94]
64 months -[82.41, 45.26, 28.76, 12.14, 7.1, 5.08, 2.63]
32 months- [63.53, 35.1, 20.32, 10.5, 7.83, 6.28, 3.9]

Next step is tying those into forecasted revenue streams for some mol producers. I've compiled estimates of mol production per year for relevant mol producers. I can turn that into a monthly production number to be sold at the forecasted price and with some deductions made for cost per pound estimates, a distribution of mol profits can be had.