Saturday, July 27, 2013

US Paper Towel Waste: How Many Do We Use?

In the previous post, I've justified a range of 13-15 billion pounds of paper towels used in 2012. Smith's talk aimed at making people conscious of proper paper towel usage, which should make one towel sufficient for the purposes of drying hands. More than one would be waste. Joe Smith's TED talk claims that using one less towel per day per person will save over 571,230,000 pounds of paper per year. That was in March 2012. 

The population in March 2012 was 313,152,958. One paper towel for each person in the U.S. each day for a year is 114,300,829,670 towels. That implies a weight per towel used by Smith of 0.005 pounds, or about 2 grams (2 paperclips). RISI estimates that 2/3 of tissue consumption is at home while 1/3 is in commercial use. I assume overuse is most prominent in the commercial context. 1/3 of the 13-15 billion pounds is 4.3-5 billion pounds of paper towels used commercially. 

I'd think that the amount of towels pulled from a dispenser is something like a log-normal distribution in a commercial context. In my experience, I don't often see a person use one paper towel or one napkin at the table and so I'd put the peak at 2 per use. I'll split the probabilities arbitrarily, on my own guess, up like this:
20% - 1 towel
45% - 2 towels
30% - 3 towels
10% - 4 towels
5% - 5 towels

That would put around a billion pounds of commercial paper towels (or 200 billion individual towels) as used properly, and the remaining 3.3-4 billion pounds (or 660-800 billion individual towels) as waste. Saving one towel per day per person such as Smith did is a wise thing to estimate because it deals in mostly concrete values and not on your own idiotic and unfounded estimates, but detailing the context to orders of magnitude starts to illuminate the waste of what can be saved.

US Paper Towel Waste: Where do Joe Smiths numbers come from?

In the previous post, I started coming up with figures on US paper towel usage with the end-goal of finding where the numbers used in Joe Smith's TED talk came from. His claim is that 13 billion pounds of paper towels are used in the U.S. each year. My best from Googling gave me a number of around 7 billion, so notably far off and needs straightening out. I'll do that here.

 The RISI estimate for 2012 tissue usage in North America (a blanket term including the different forms of towel and tissue) was around 18 billion pounds, so Joe Smith's number includes about 70% of the total tissue usage in 2012. Working off a 2008 report by RISI,
The North American tissue market is comprised of toilet tissue (45% share of North American consumption), toweling (36%), napkins (12%), facial tissue (6%) and other uses, including sanitary (1%).
 it seems reasonable that he is assuming the lions share of the toweling and toilet tissue market, ie, 45+36= 81%, which gives ~15 billion pounds. Smith's talk was given in 2012, so I'd assume he is using 2011 numbers instead of 2012 numbers. Organic growth could account for some of the discrepancy. A growth from 13 billion to 15 billion year-over-year is a 15% growth, which is too much growth to be reasonable as solely accountable. My guess is that the discrepancy lies in the percentage breakdown of tissue use. My numbers are from 2008, while his could be from more current years. For example, if the 45% toilet tissue and 36% toweling percentages (totaling 81%) changed to 43% and 34% (totaling 77%), 15 billion pounds drops to 14 billion pounds.

I'll assume that a combination of organic growth within the tissue market and shifts in end-use percentages close that gap and the 15 billion pounds in 2012 is probably more like 13-15 billion pounds of "paper towels" used in 2012.

Friday, July 26, 2013

U.S. Paper Towel Waste: Testing the Bounds of Google Search

There's a TED talk by Joe Smith about using paper towels properly. He claims some numbers on paper towel usage and waste. I'm going to see if I can get something close with Google and estimations. It'll go something like this

1. How much do we consume per year (for comparison against his number)?
2. How much of that is unnecessary use?

Now for getting some estimates for these values. Digging around the internet, you'll find things like this dug from netdryers.com:
According to Tissue World magazine’s April/May 2012 edition,
 the US Tissue Market is a $16B market of which 37% is AFH (Away From Home).

Tissue World magazine. 'Nuff said.

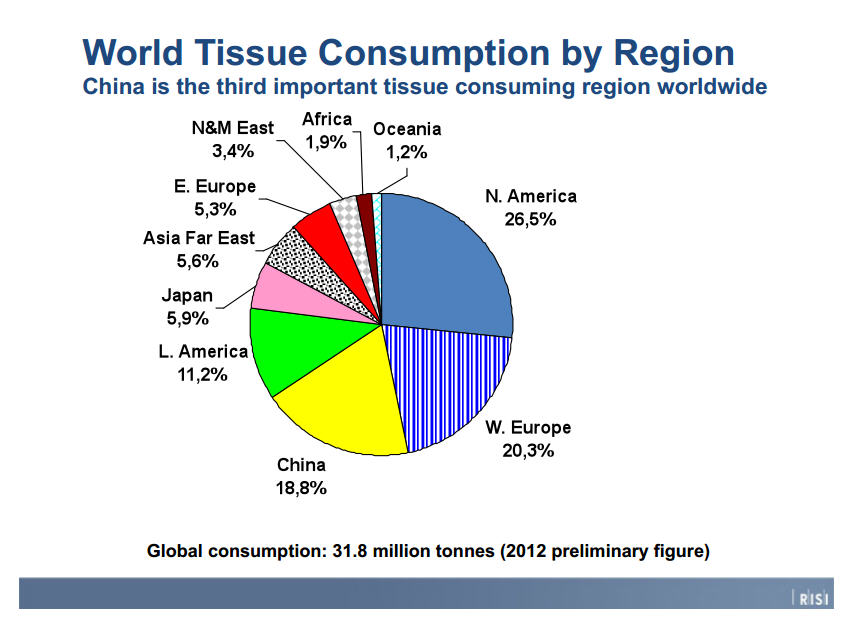
I'm taking a crack at (2) first. Fortunately, consultants exist. RISI, an information provider for the foresting industry, produced this chart:
RISI, through this chart, claims that North America uses 26.5% of 31.8 million tonnes, or ~70 billion pounds of tissue per year. North America tissue use is then 18.58 billion pounds. Tissues is a broad category that includes bathroom tissue, hand tissues, paper towels, sanitary towels and so on. A report from RISI exists free of charge on the internet (probably because it's from 2008 and we all know the paper towel industry is cutthroat and if you don't keep current with supply/demand statistics, you'll get wiped up by the competition), and claims that in 2008, 36% of the tissue market consists of "toweling", which I assume is the category I'm looking for. Perhaps the most obscure Googling I've ever done followed: historical toweling consumption,


which gives results about what would be expected. I have work in a few hours so I'm going to be lazy and assume that there isn't much shift in end-use percentages of tissues from 2008-2013 in the US. I would worry about this if the developing world was involved because I'd assume as per capita wealth in the developing world and namely China increases, the percentage of paper towels used would increase since paper towels feel like the most discretionary version of tissue that I use.

So, we have total US tissue consumption in 2012 and an estimate for how much of that consumption is in towels. 36% of 18.58 billion pounds is 6.689 billion pounds of tissue used per year.

I'm wiped out and you've absorbed all you can about paper towels today, even if I've quilted the readily ply-able information elegantly (which I haven't).

Next step is to haggle with the severity of all you peoples waste.

Monday, July 8, 2013

Annual Mol and Copper Prices, 1900-2011 and the '79 Spike

Courtesy USGS,

The focus here is '79. The cause of the price spike was the Iranian Revolution causing a oil shortage. The response was to expand oil production elsewhere through building new wells, which need molybdenum. Molybdenum demand spikes. On the supply side, the Endako mine went on strike. As with the 2000's spike, the inability to quickly raise production to meet demand is the catalyst for sharp price increases.
Not the most elegant plot, but the level of production increase around '79 is clearly comparable or less than many other years from 1960-1990. Higher resolution data would be nice but annual is all that is available. I doubt in 1920 monthly molybdenum price data was not a key concern.

Saturday, July 6, 2013

Metals Basket: Value of $1 through time

Playing around a bit more with the daily metals data from Quandl. Does molybdenum move with the crowd?

Investing in any of these metals, at best, gives you your buck back. Molybdenum looks like it plays by its own rules and has had a period of less volatility than others in the metals basket, although the graph is a bit noisy. One part of the heteroskedastic, anyway.

Next, try to find long term data (back to early 2000's, or even 90's) of other metals to match with my set of monthly molybdenum returns from '93 to 2013 to incorporate both volatile (94ish, 2004-10) and stationary periods.

Tuesday, July 2, 2013

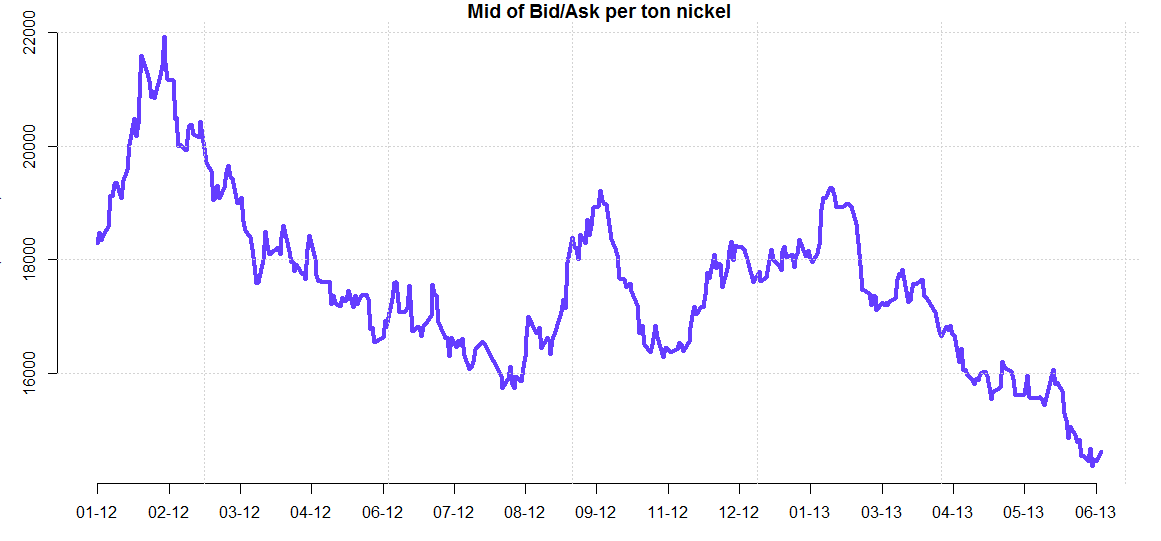
Metals Basket, 2012-2013 Mids of Bid/Ask Spread

Quandl has a variety of metal bid/asks. I'm not sure how to massage data with missing elements into the same plot so I've done them separately. It would be worth fixing the plots so that the scales match because the apparent volatility from plot to plot is not comparable and could be deceptive on little examination. 


Some variation, but largely following the same trends. Would be useful to make a rolling average for each plot and put them on the same plot to cut the noise down. Now here's molybdenum:


Point being, molybdenum plays by its own rules. It's unfortunate that (free) molybdenum data only exists at the start of 2012, although Quandl adds onto the series daily.

 Next, stack rolling averages and look for divergences within the group.